NVDA analysis

Read the company and the chart.
Then define the condition.

Useful NVIDIA analysis connects business evidence with price behaviour. It explains what matters, what would confirm the view, and what would invalidate it.

4
Analysis lenses
NVDA
Single-stock focus
1
Invalidation per scenario
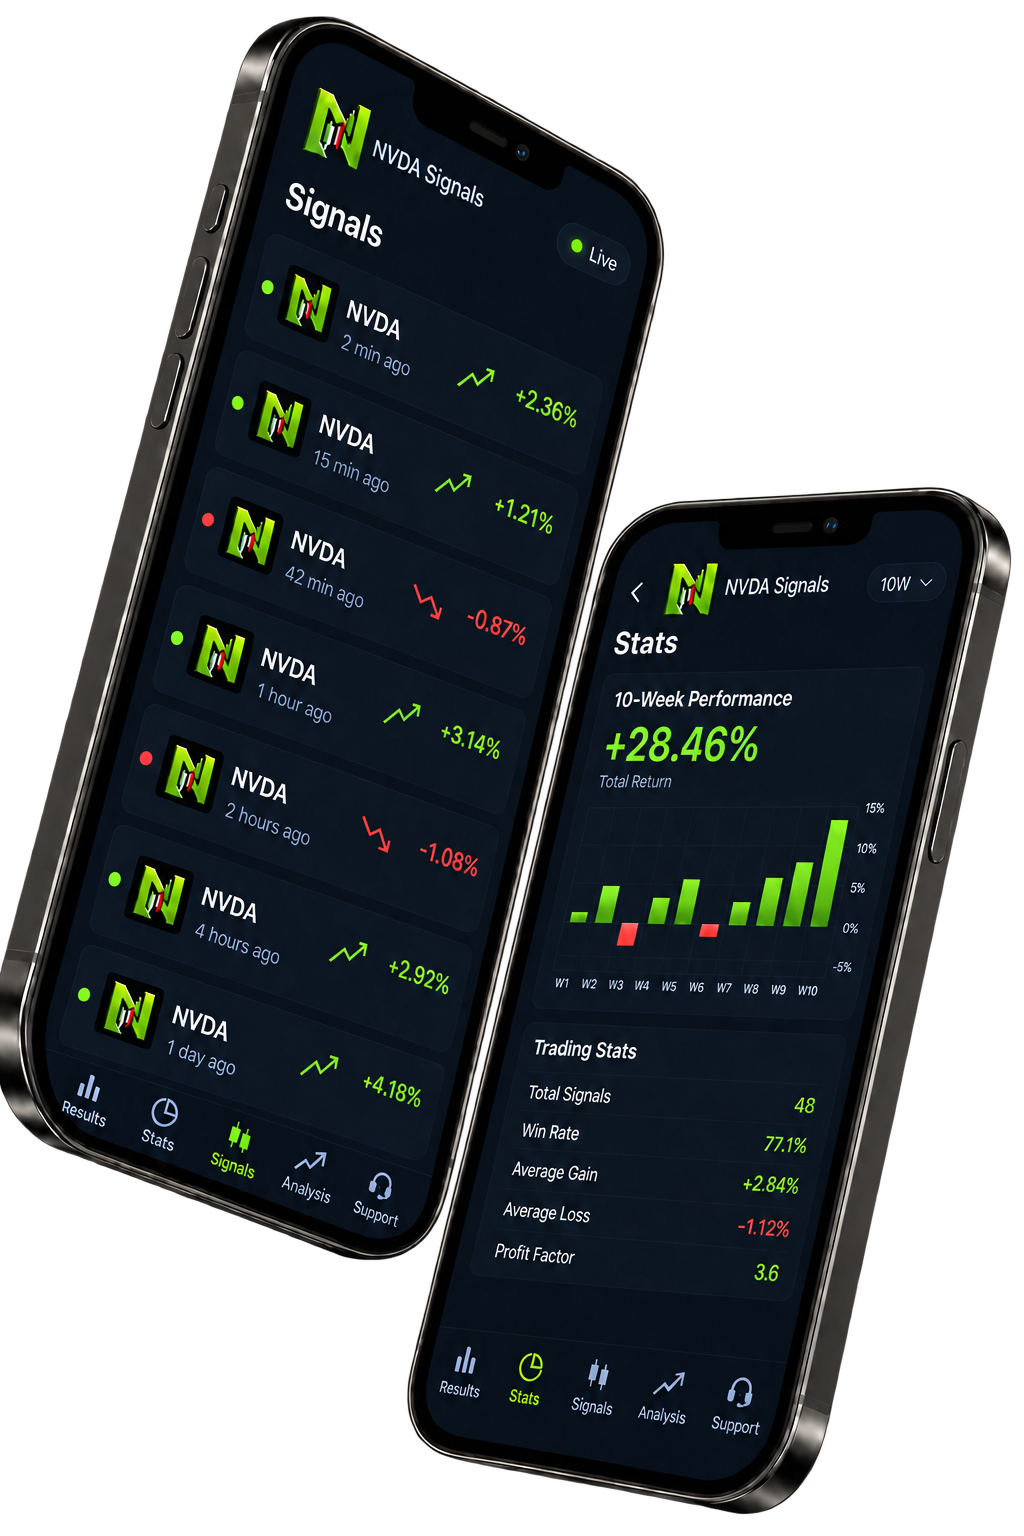
NVDA Signals app showing signal times and profit and loss
Analysis lenses

A complete view of NVIDIA.

Company evidence

Start with earnings, guidance, data-centre demand, customer spending, gross margin, operating expense, product execution, and supply. A chart move can reflect a change in expectations rather than a change in the latest reported quarter.

Price and volume

Mark the higher-timeframe trend or range, important gaps, prior breakout zones, volume response, and regular-session acceptance. A brief pre-market move is not the same as sustained liquidity.

Sector and index context

Compare NVDA with the semiconductor group, Nasdaq, major customers, and broad risk appetite. Relative strength can support a thesis; sector-wide weakness can undermine an isolated chart pattern.

Catalyst and invalidation

Earnings, product events, export controls, analyst revisions, and rates can alter the evidence quickly. Every scenario needs a condition that would make it wrong.

From an NVIDIA price level to a stock setup.

Illustrative prices; not a current signal or recorded trade.

The area and the entry condition

Suppose a regular-session NVDA chart has a resistance area at $182.00. The idea requires a 15-minute candle to close above that area, followed by a retest that holds it. A touch of $182.00 alone does not activate the setup.

For this example, the planned entry is $182.40, the invalidation reference is $180.90 and the first planning objective is $185.40. Cancel the idea if the retest fails before entry. If price gaps beyond the planned entry area or the session ends without confirmation, review the setup again rather than carrying those conditions forward unchanged. No outcome is assumed.

Turn the price distance into share risk

The entry-to-stop distance is $182.40 − $180.90 = $1.50 per share. For arithmetic only, a $75 cash-risk input divided by $1.50 gives 50 shares, with a planned notional value of 50 × $182.40 = $9,120. The NVDA share position-size calculator uses the same price-distance calculation. Fees, slippage and a gap through the stop can make the actual loss different.

Keep the session and company evidence together

Nasdaq's normal stock session is 09:30–16:00 Eastern Time, with holidays and early closes listed in its official trading schedule. Premarket or earnings gaps can change both the quote and available liquidity; this regular-session example does not become an extended-hours setup automatically.

Check NVIDIA's financial reports for company evidence and the NVDA event calendar for the events to confirm. To see how the setup fields stay together in the product view, review the NVIDIA signal format and current app details.

Decision process

From company context to a reviewable setup.

1. Separate fact from expectation

Identify what the company reported and what the market had already priced in.

2. Build scenarios

State what would support a constructive, range, or defensive path.

3. Define risk

Choose invalidation before share quantity and account for gap risk.

4. Wait for evidence

A forecast is not an entry. Use price and volume confirmation before acting.

This framework is educational. It does not provide a current price call, personalised advice, or a guaranteed outcome. Confirm current company information and live market data before making a decision. NVDA Signals is independent of NVIDIA Corporation.

Follow NVDA with clearer context.

Review structured alerts, closed outcomes, and focused market education in NVDA Signals.

Reading the NVDA chart.

What should I check in NVIDIA technical analysis?

Start with the trend, support and resistance, volume and the latest company or market catalyst. A level matters more when the price response supports it.

Is a support or resistance level an entry signal?

A level marks an area to watch. An entry condition explains what price needs to do there, while invalidation defines when the setup no longer holds.

What happens if NVDA gaps past the planned entry?

Review the conditions and price distance again rather than treating the old entry as unchanged. A regular-session setup does not automatically apply in premarket trading or after an earnings gap, and a stop does not guarantee its fill price.

How does analysis differ from a forecast?

Analysis explains the evidence on the chart and in the business. A forecast sets out conditional paths from that evidence. A trading signal adds the conditions and levels for a specific setup.